The right maintenance data at the fingertips of OEMs, tooling engineers, mold designers and builders, toolroom managers and repair technicians will move shops away from a firefighting culture to a proactive, continuous improvement, data-driven culture. All Photo Credit: MoldTrax
Part 1 reviewed the various maintenance cultures found within shops, identified necessary mold data and explained the inadequacies of journal-entry systems. Part 2 discussed the type of data that a shop must collect and the most appropriate means of data collection. This final series installment will explain how to use this new data.
The question is, now that you know how to categorize issues, create standard terms for stop reasons, defects and corrective actions and use these terms in your enterprise resource planning (ERP), computerized maintenance management system (CMMS) or homegrown Excel system, what is all this documentation going to do for you?
It’s simple. You are translating maintenance stories into measurable data through standard terminology, which will provide reports that offer information highlighting the molds that need attention to improve performance when set up within your current maintenance system.
To many toolroom technicians, “improved mold performance” means “fewer breakdowns.” Although this is a necessary factor, there are other “critical to performance” factors you must consider when performing every mold preventative maintenance (PM) or looking for ways to decrease maintenance costs.
The key to truly improve mold performance are reports that reveal the problems/degree of problems affecting a mold.
“Improved mold performance” means a mold runs at the most productive efficiency level in the following eight ways. The importance of each varies from company to company and across various job functions.
- Run more reliably—reduce unscheduled breakdowns.
- Run with higher quality parts—produce parts with tighter CPK ranges, reduced flash and other potential quality issues.
- Run with higher cavitation—block fewer cavities.
- Reduce high tooling costs—maximize the life span of all tooling components.
- Reduce high labor costs—identify molds that require extensive labor/shop hours to repair or clean; design for maintainability.
- Run to required cycle time—run to the designed cycle time or (dare I say it?) faster, if possible.
- Run with more consistent/repetitive startups—create a process to stop shooting 50 times to get acceptable parts.
- Reduce maintenance mistakes—provide technical tips to aid in the safe disassembly, troubleshooting, corrective actions, cleaning and reassembly.
Proactively attacking these eight areas requires more than a person’s memory of mold-specific issues or a logbook entry when the mold was last maintained. You must have reports based on a molder’s exact short- and long-term needs that provide targets for the shop to formally address, which yield goals.
Many molders believe that the way to improve mold performance is to perform more PMs or more in-depth PMs. This might be true for toolrooms that do/do not perform PMs at a scheduled frequency. However, most companies do perform basic PMs. The real issue is that most do not specifically focus on improvements within any of the eight factors noted earlier. It’s like servicing your car at the recommended miles, but it still won’t start, drive or run reliably, and no one really knows why so you just try to push it through one more run.
The key to truly improve mold performance are reports that reveal the problems/degree of problems affecting a mold, so you can accurately determine the issues that require a root cause analysis to eliminate or reduce performance-degrading defects. Without these reports, molders can only perform more in-depth or more frequent PMs hoping that a mold will then run better.
Performance Metrics Breakdown
To illustrate how this works, let’s use an actual database to determine targets and set goals with real, measurable data. A good analysis starts with a 30,000-foot view. It then moves into a more detailed look to nail down targets and set goals to attack the targets with even more in-depth data, such as positional analysis, required tooling and labor and specific corrective actions performed.
Unscheduled Mold Stops

Figure 1. Top ten X stops.
The most important and costly issue to address is unscheduled mold stops, which have been said to cost companies five times as much as scheduled stops. Keep in mind there are dozens of reasons a mold might be stopped, but there are only two categories—scheduled or unscheduled. All unscheduled reasons must contain a prefix such as “x-flash issues” so they can be easily sorted in a database. Once created, you can count this term and point it to a mold.
Figure 1 shows a list of the top unscheduled mold stop reasons (or x-stops) over one year. This data was taken from an actual molder’s database housing six years of production data. The top item is Flash Issues, which is the standard term assigned to molds that are stopped to repair typical flash issues. Your database will then identify which mold was stopped the most for Flash Issues. For example, Figure 2 shows #6721 as the worst offender.
High Defects
Using Figure 2, you can drill further into the data to discover not only which mold is having the flash issues (6721) but what the specific flash defect is. Figure 2 clearly shows that vertical flash on the angled and straight ejector bar is why this mold has more unscheduled mold stops than any other mold in the shop. Now you have a viable target for the toolroom technician to focus on the next time that mold comes in for repair or a PM. This issue will never cease or reduce the frequency until repair technicians are aware of the severity of its frequency. Only then can they analyze positional and corrective action data to discover a root cause. Remember that this is not the most frequent defect of all your molds. Rather, it is the defect causing the 6721 to have the most unscheduled mold stops.
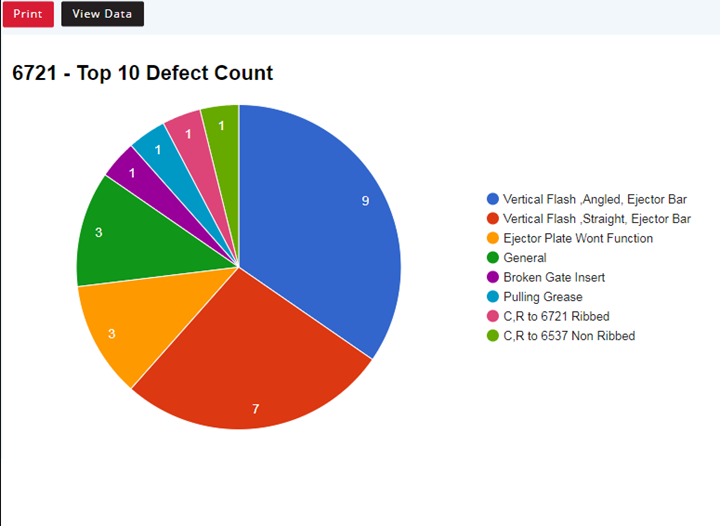
Figure 2. Top ten defect count.
Lost Production
Now let’s address which mold is creating the most defects requiring you to shut off or block a cavity. This relates directly with running at higher cavitation or improving the cavitation percentage of your molds. You need to find out what is stopping the mold from running at 100% cavity efficiency. The first step is identifying what mold is suffering the most blocked-off parts.
Chart 1 shows that during one year, the 6870 mold created 16 total issues that were blocked or shut off during production. The “long gate” is the top defect causing lost production—millions of parts. This establishes the next target for the toolroom to investigate. They must now identify if the long gate issue or defect is related to mold position, the press, time of day, material type or personnel.

Chart 1
High Tooling Costs
Lowering tooling maintenance costs is next on the list of improvements. To begin, you need to know which molds are the most costly to run. For example, determine which mold is using the most tooling over one year. Or better yet, determine what your average tooling costs are for this mold to run a specific amount of cycles—100,000—as compared to your other molds. Data is the key.
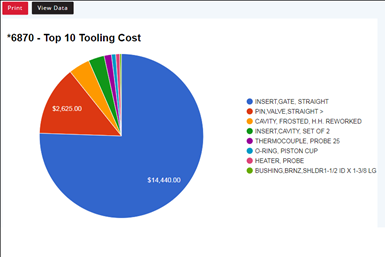
Figure 3. Top ten molds by tooling costs.
Mold 6870, for example, shows up in two different reports (Figures 3 and 4) automatically total up the overall tooling costs and display them in a similar pie chart. Figure 4 breaks down these totals to identify the specific component (gate inserts) contributing the major cost of running this mold. Next, you must ask yourself the following:
- Are these gate inserts breaking or wearing out?
- Is it the same gate repeatedly breaking?
- Is the occurrence random or a pattern?
- What is the insert’s life?
- What is the current corrective action?
- Is it a new gate or a reworked gate?
- Should we get the mold builder on the phone for a discussion?
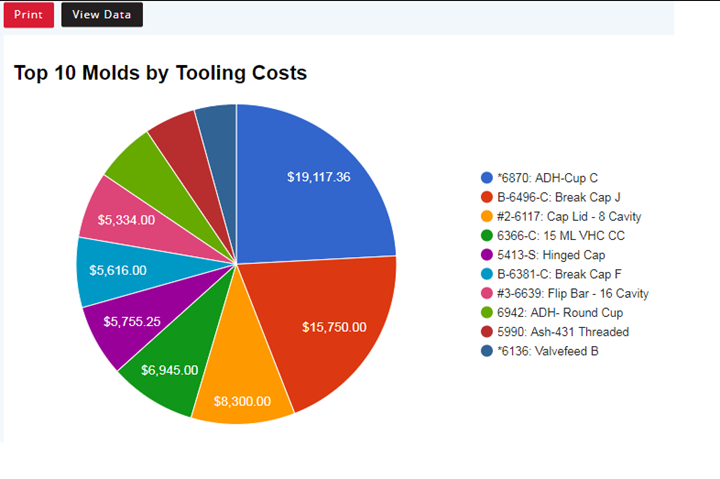
Figure 4. Top ten molds by tooling cost.
This data helps with root cause analysis discovery. Remember that you can’t fix what you are not aware of, and you won’t be aware of it without measurable data.
High Labor Costs
Specific mold labor costs are often overlooked because companies pay repair technicians a daily hourly rate to keep molds running. If analyzing specific mold labor hours is not something that can be done easily, most shops ignore it and focus on the day’s hot job.
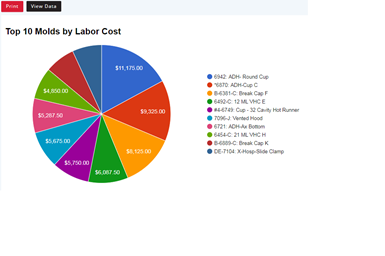
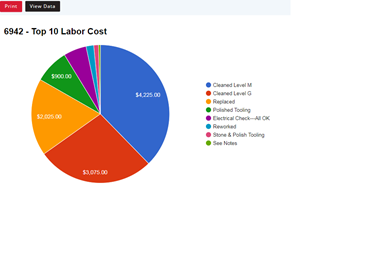
Figure 5 (top) and Figure 6 (bottom).
You should evaluate specific mold labor costs just like you evaluate tooling costs because some molds lack maintenance-friendly features and can take hours for a tech to perform a simple repair, disassembly or cleaning. Understanding labor costs will help you schedule more effectively and justify investment in advanced cleaning equipment such as ultrasonics, dry ice blasting, plastic media blasting and laser cleaning.
Figure 5 shows that the 6942 mold required the most labor hours of all the molds. Figure 6 breaks down the hours spent on general and major cleaning. These cleaning levels may be further broken down to see exactly how the shop time was spent. Then you need to determine when the cleaning was performed, the type of cleaning procedures, etc. I’m sure you get the picture now.
Having this type of data at the fingertips of OEMs, tooling engineers, mold designers and builders, toolroom managers and repair technicians will move shops away from a firefighting culture to a proactive, continuous improvement, data-driven culture in which techs can measure, target and attack high-cost, high visibility issues. To start, work with your current work order or maintenance system supplier to learn how to add standard terms and dropdowns to keep data accurate and easy to input.
Related Content
How to Select a Mold Temperature Controller
White paper shares how cooling channel analysis, which collects maximum pressure drop, total flow rate and heat dissipation, eases the performance evaluation of mold temperature controllers.
Read MoreThree Good Reasons to Switch from Three- to Five-Axis Machining in Moldmaking
Five-axis machining technology is a great tool in the moldmaker toolbox.
Read MoreHow to Analyze and Optimize Cutting Conditions to Reduce Cycle Time
Plastic injection mold design and manufacturing company puts NC program optimization software module to the test. The results were surprising.
Read MoreMold Design Review: The Complete Checklist
Gerardo (Jerry) Miranda III, former global tooling manager for Oakley sunglasses, reshares his complete mold design checklist, an essential part of the product time and cost-to-market process.
Read MoreRead Next
What Is Scientific Maintenance? Part 1
Part one of this three-part series explains how to create a scientific maintenance plan based on a toolroom’s current data collection and usage.
Read MoreWhat is Scientific Maintenance? Part 2
Part two of this three-part series explains specific data that toolrooms must collect, analyze and use to truly advance to a scientific maintenance culture where you can measure real data and drive decisions.
Read MoreHow to Use Strategic Planning Tools, Data to Manage the Human Side of Business
Q&A with Marion Wells, MMT EAB member and founder of Human Asset Management.
Read More


