Building a Better Mold
A look at mold performance and maintenance issues through a few simple reports in the right sequence will allow you to drill down into what the issues are really costing you.
Too many American plastics manufacturers spend money on molds and the subsequent repairs (tooling and labor) without tracking and analyzing mold performance and repair issues, which often leads to cloning old problems into new molds. Then when the company CEO calls an emergency meeting to announce that the business is going elsewhere or the plant is being shut down to “save costs” we wonder what happened. Which costs? Whose costs? What products?
Without a photographic memory, we must track to improve. How to track is another article. For now let’s get right to the pay-off. Let’s look at mold performance and maintenance issues through a few simple reports versus a mind probe or shop poll.
Find the Bad Apple
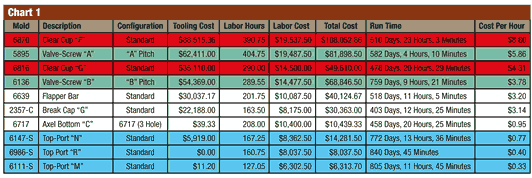
This article will show how specific reports/charts can guide the user to molds that are quietly eating away company profits. Using the actual database of a plastics molding company, let’s first examine Chart 1 that was used to quickly tell us which molds run the most (top 10) and their repair costs divided into production hours to get a CPH (costs per hour). Maintenance costs must be divided into cycles or run time hours to set an accurate baseline in which to reference. Total costs won’t tell you much by themselves. They have to be related to mold or part /production defects.
Chart 1 shows the top 10 running molds sorted first by Run Time then by CPH (cost per hour). This shows how much it costs (total of labor and tooling) to maintain the top 20 runners per production hour. The molds highlighted in red run the same part from identical molds built by the same company and only one year apart. But for some reason the maintenance costs of the 6870 far exceeds (by $58,442.00) the costs to run the 6816 even though the run time column shows only a 32-day difference. What is going on here? Why is this newer mold using much more tooling compared to its older sister?
Also notice the (green) 6136 valve screw “B” costs about two dollars per hour less (or $13,052.00) to run than its twin sister the 5895 Valve screw “A” even though “B” ran 277 days longer! So right off the bat, two big flags appear that warrant these molds’ histories being further reviewed by examining and comparing their defects and subsequent corrective actions to see where the dollar difference is.
It is logical to expect that if the molds were built by the same vendor at the same time, the molds should perform the same within consistent process parameters and standardized maintenance practices. Any variation in these three criteria, then it could be a whole new ball game concerning performance and maintenance characteristics. Imagine, then, if a call came through requiring a couple more molds just like these be built, one could create a brand new money-guzzling-lemon if this data is ignored.
Look Closer
This report also raises a few interesting questions about the three identical molds highlighted in blue, even though they are the most efficient running molds in the top 10. The molds are again clones, but the 6147 used almost $6,000 worth of tooling, while the other two used hardly any. Of the three, 6147 also ran the fewest cycles. So again, what tooling was replaced and why was it replaced? Was the tooling worn out or broken? Is the same tooling requiring replacement? When was it replaced and who replaced it? Would anybody in a shop remember the details surrounding these molds through several production runs and repairs? Hardly. But if this type data is not analyzed it is just standard cloning practice to say “build it” to the vendor.
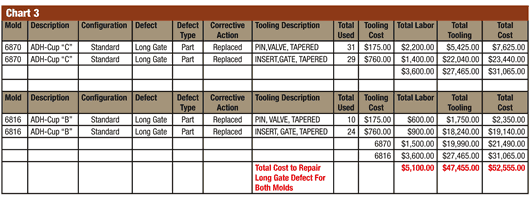
For now we will drill into the most expensive (to run) mold of the top 10 and see what we can find out before these issues are built into another mold. Chart 2 shows a summary of the top defect for both molds—116 Long Gates. Let’s look at corrective action data for that defect.
Chart 3 displays what tooling was replaced to correct the long gate defect in both molds. The total cost of the tooling and associated labor is seen on the far right. $52,000.00 is quite a lot of money spent to correct only one defect. The next step was to sort and filter on corresponding criteria that surrounded the defects looking for patterns or trends—such as start times, start technician, press number, repair dates and repair technician. Also inspected were spare tooling (valve pin and gate inserts) components to verify design specifications from the vendor to validate interchangeability and stack dimensions between the two clear cup molds.
The Outcome
When nothing out of the ordinary was discovered in the shop, a call was placed to the hot runner manufacturer to discuss the problem.
The hot runner manufacturer had questions concerning the number of cycles the valve pins and gate inserts had on them, and if the long gates were coming from any particular locations within the 32 cavities. Here is where the conversation could have gone grey, but we were ready with even more data. Having accurate reports just a mouse-click away to show cycle counts, defect position, number and type of PMs given to the mold at specified frequencies, and then providing documentation to demonstrate that standardized procedures exist—and are followed—for removing, cleaning, inspecting, repairing and installing the tooling is indispensable.
This company was considering purchasing—or cloning—more of these molds using the exact same technology and design. Through accurate data collection, not only was a design issue (tapered shut-off valve pin to a thin land area at the gate) uncovered in the mold, but R.O.I. justification was established through correction action costs, allowing them to redesign/rebuild the old molds and improve upcoming clones. The ability to track and sort critical data allowed an accurate resolution and many repair dollars saved.
As maintenance awareness increases in companies looking to reduce costs, be sure to associate all costs with specific events or issues—such as cleanings and mold or part defects—to understand exactly the past problems and to aid in troubleshooting and establishing corrective action costs before you clone these problems into other molds.
Related Content
Making Quick and Easy Kaizen Work for Your Shop
Within each person is unlimited creative potential to improve shop operations.
Read MoreMMT Chats: Solving Schedule and Capacity Challenges With ERP
For this MMT Chat, my guests hail from Omega Tool of Menomonee Falls, Wisconsin, who share their journey with using enterprise resource planning (ERP)—and their people—to solve their schedule and capacity load monitoring challenges.
Read MoreMold Design Review: The Complete Checklist
Gerardo (Jerry) Miranda III, former global tooling manager for Oakley sunglasses, reshares his complete mold design checklist, an essential part of the product time and cost-to-market process.
Read MoreTackling a Mold Designer Shortage
Survey findings reveal a shortage of skilled mold designers and engineers in the moldmaking community, calling for intervention through educational programs and exploration of training alternatives while seeking input from those who have addressed the issue successfully.
Read MoreRead Next
Ready-To-Go Molds
By properly designing and building molds that are ready-to-go, moldmakers can shorten leadtimes and stay competitive.
Read MoreHow to Use Strategic Planning Tools, Data to Manage the Human Side of Business
Q&A with Marion Wells, MMT EAB member and founder of Human Asset Management.
Read MoreReasons to Use Fiber Lasers for Mold Cleaning
Fiber lasers offer a simplicity, speed, control and portability, minimizing mold cleaning risks.
Read More
