Benchmark Your Injection Molding Simulation
Use benchmarking to gain confidence in your modeling, material and simulation capabilities, then use the simulation results to guide future design.
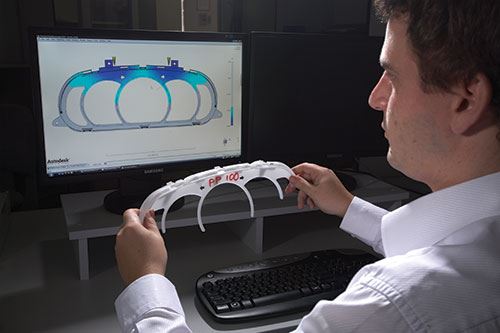
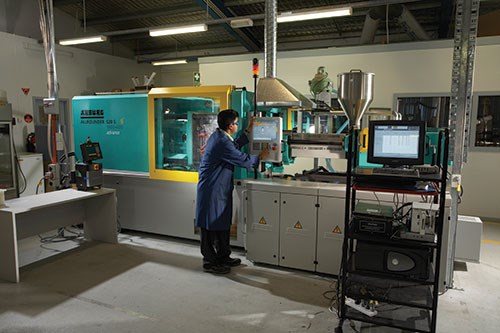
The use of CAE for injection molding simulation has progressed from flow-front prediction in the late ‘70s to full simulation of the injection molding process, its variants and associated processes. Injection molding simulation benchmarking is the comparison of predicted and actual process parameters. Typically, an extensive study is carried out on a mold, machine and material combination, where filling pattern, injection pressures and part warpage are reviewed. Best practice requires that the inputs and outputs from an injection molding simulation agree as closely as possible to the actual conditions of a real-life molding machine.
Injection molding is continually demanding more from designers, as mold design changes after the mold is already built are expensive. Injection molding simulation is cost-effective compared to manufacturing physical prototypes and offers great benefits to those using it early in the manufacturing process.
Simulation of injection molding has a higher return on investment than simulation of other plastic manufacturing processes. The objective of benchmarking is to gain confidence and experience in modeling, material and simulation capability, and to then use simulation results to guide future design. An important reason for benchmarking is to confirm simu-lation results when users are first introduced to injection molding simulation applications.
Simulation Accuracy
The accuracy of injection molding simulation is influenced by many factors. For example, predicted filling patterns, the location of weld lines and hesitation marks. Modeling of wall thickness is important and needs to include changes made towards the end of the design cycle. If it does not, the CAD model used as a basis for the simulation model may differ significantly from the actual mold.
Predicting the pressure required to fill a mold (assisting with machine selection) requires modeling of the runner, sprue and gating design. In addition, if simulated injection pressure is compared to a measured nozzle pressure, then the pressure drop in the nozzle and the contraction into the nozzle tip must be accounted for. This can be done either by including the nozzle body and contraction in the simulation model (assigning a property similar to hot runners) or by performing an air-shot experiment. In an air-shot experiment, the molding machine injection unit is retracted away from the mold and an injection shot is performed at typical injection speed, but with polymer extruding freely out of the nozzle tip rather than flowing into the sprue or hot runner.
Predicting the ejected part’s final warped shape requires an accurate reflection of the process settings in the simulation: in particular, packing time and packing pressure (or pressure profile), cooling time, and any relative difference in coolant temperatures. These factors have a strong influence on shrinkage and warpage. The discretization of the geometry into finite difference grids, finite elements or finite volume cells also plays a key role in simulation accuracy. The mesh size must also be considered with respect to the type of numerical solution being used.
Simulation inaccuracies can arise due to errors in:
• Software: incorrect coding of a mathematical expression and/or its associated boundary conditions.
• Geometry: the real part is not reflected in the import of geometry and the subsequent discretization used to define the computational domain.
• Material data: inappropriate data for the materials used to produce the part.
• Input data: processing conditions used in the simulation
differ from those used in the manufacturing process.
• Post processing: manipulation of calculated data for post
processing.
• Experimental data: poor experimental technique, poor
instrumentation or transducers.
Experimental Accuracy
Molding machines are continually advancing, and a wide range of machines is available. It is important to understand both injection molding machine fundamentals and the actual machine being used, including its capability, screw movements, check-ring valve performance, material preparation (drying), nozzle pressure (or hydraulic injection pressure multiplied by the screw intensification ratio) or cavity pressure, shot-to-shot variations, venting, sensor types, and reliability.
To help detect machine problems, movement and check-ring valve performance, process monitoring, and machine performance should always be reviewed prior to the start of a benchmark. Material drying can cause process stability issues and melt viscosity differences. The ideal relationship between nozzle melt pressure and hydraulic injection pressure is the ratio of piston to screw area. This is referred to as the screw intensification ratio or gain, and is typically equal to 10. It may vary considerably depending on screw and piston geometries, however. The apparent screw intensification ratio also may vary due to temperature changes compressing the hydraulic oil, frictional effects between the screw and barrel, and the influence of polymer melt compressibility during the filling process.
Benchmarking
Injection molding simulation benchmarking requires an appreciation of simulation technology and knowledge of the assumptions made in the simulation:
Filling inputs. The most important input that influences filling pattern is mold geometry, so an accurate representation is essential. The most important influences on injection pressure are geometry, switch-over from velocity- to pressure-control stages, material viscosity and injection speed (profile or constant).
Geometry. Time is often spent analyzing the results of simulation of an intricate feature only to find that the feature was not modeled correctly. An actual molded part should be reviewed for obvious errors. Tool life also should be considered, since several modifications may have been made. The model used for the injection molding simulation may be from the part design, so the moldmaker’s shrinkage allowance will not be included in any dimensions. Nozzle, runner and gate geometries also are not always included in a simulation model, and these features can have a considerable effect on simulation results, particularly pressure to fill.
Velocity to pressure control transfer. Switch-over from velocity to pressure control is set by screw position or time. The full geometry must be modeled accurately or percent volume filled or automatic options selected. Molding simulation often uses the latter, so it is essential to verify that this is a reasonable approximation of the molding machine’s settings.
Viscosity. When a material is not present in the materials database, it is common practice to choose a material with a similar melt flow index (MFI) or viscosity, from the same polymer family, with similar filler levels, or from the same manufacturer. A 10-percent difference in filler weight can be expected to yield a 10-percent difference in pressure prediction. However, as much as a 40-percent difference in pressure can be expected with material data from a different manufacturer, because viscosity is also indirectly affected by the material’s thermal properties.
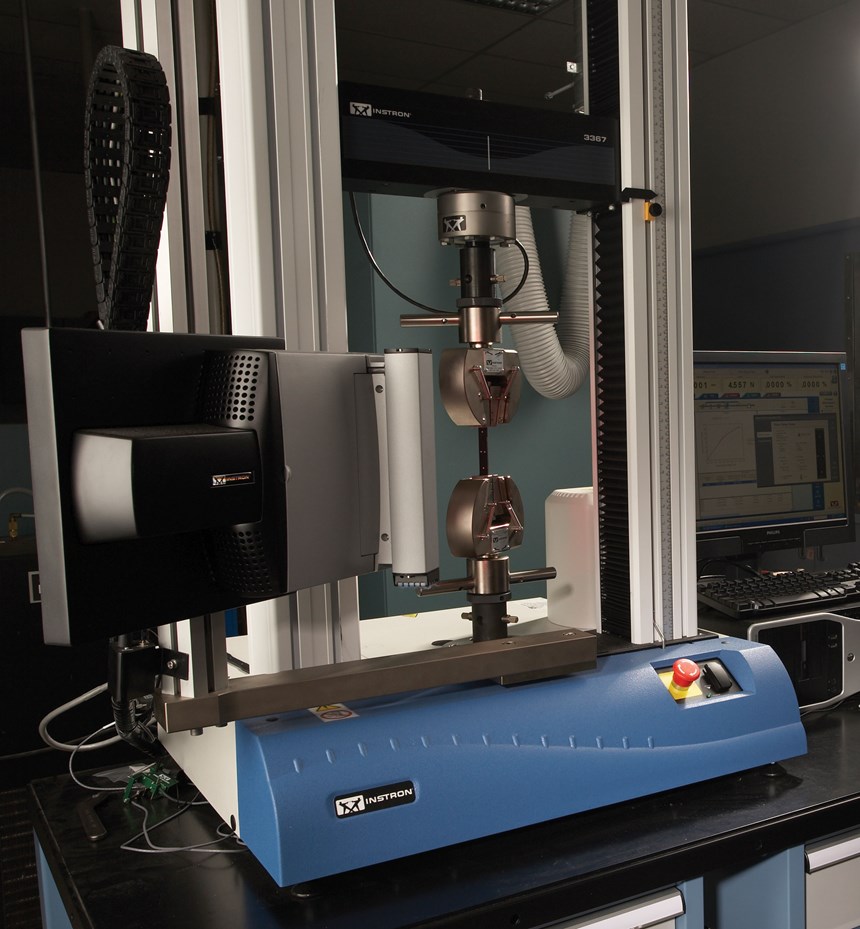
Injection velocity. The correct injection velocity (flow rate profile) also is important. The flow rate used in the simulation can be determined from readings on two cavity pressure sensors. The difference in position between the sensors and the difference in time for the flow to reach each of the sensors is used to determine an injection speed for the simulation. However, injection speed calculated in this way will show poor agreement with measured pressures.
Packing/holding pressure. There are many built-in features to ease injection molding simulation, such as a default automatic packing/holding pressure profile that uses 80 percent of the maximum injection pressure for 10 seconds. The actual pressure profile is often overlooked.
Summary
Benchmarking of injection molding simulation requires a systematic approach to eliminating problems after comparing simulation with molding practice. Therefore, when comparing simulation results to those obtained on the molding machine, it’s essential to pay attention to the factors that may cause errors: machine capabilities and response time; material preparation, characterization and stability; measurement methods (pressure or deflection); geometry inaccuracies; process setting variations; and inputs to simulation software.
Even without perfect agreement, simulation can provide great insight into performance sensitivities to process, geometry and material that can then be used by engineers to improve product design and process settings for actual production.
Related Content
Tolerancing in Mold Design, Part 2: Using GD&T to Address Conventional Tolerancing Issues
Mold designers can achieve a single interpretation of workpiece functionality when following the American Society of Mechanical Engineers Geometric Dimensioning and Tolerancing standard.
Read MoreThree Good Reasons to Switch from Three- to Five-Axis Machining in Moldmaking
Five-axis machining technology is a great tool in the moldmaker toolbox.
Read MoreHow to Analyze and Optimize Cutting Conditions to Reduce Cycle Time
Plastic injection mold design and manufacturing company puts NC program optimization software module to the test. The results were surprising.
Read MoreHow to Select a Mold Temperature Controller
White paper shares how cooling channel analysis, which collects maximum pressure drop, total flow rate and heat dissipation, eases the performance evaluation of mold temperature controllers.
Read MoreRead Next
Designing Flow Leaders and Restrictors
Use simulation to control flow in your injection molds.
Read MoreThe Kentucky Windage Solution in Simulation Reduces Warpage
Using simulation to bias your mold and reduce warpage.
Read More
