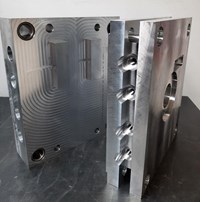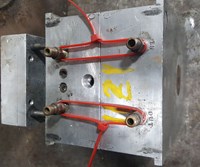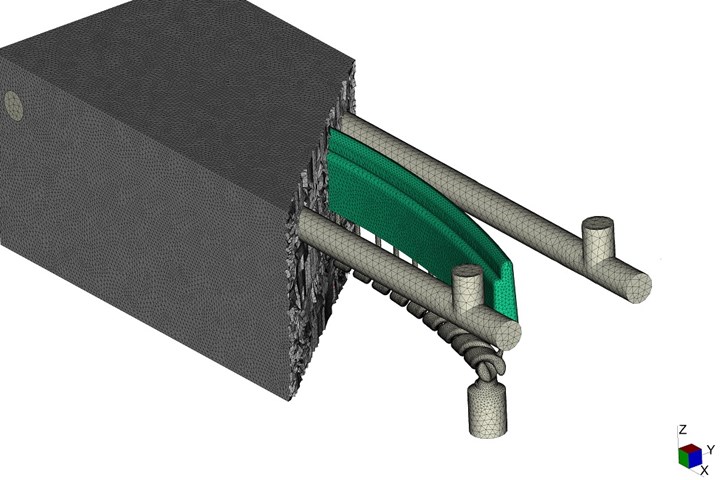
Injection molding simulation can be a valuable tool to validate mold designs prior to mold construction and first shots. Photo Credit: The Madison Group.
Many moldmakers and molders use injection molding simulation to experiment with or prove out mold designs. However, many still question the accuracy of a simulation. This series will examine how to move simulation from a check-the-box step to an optimization step in the manufacturing process that gets products to the market quicker and at a lower cost.
Let’s start with a focus on how to ensure success and evaluate goals. Here are four steps for replicating mold performance after gate location selection.
Step 1: Define the analysis objective
While simulation can simulate most stages of the injection molding process, it is not always required to have the entire mold design to use this tool effectively. By defining the objective, you can better define how much of the mold design you must include in your models.
Often, for mold filling, the analysis’ objective is to fill the mold and pack out the part to avoid excessive sink issues without requiring excessive pressure. The minimum requirement for creating a digital twin of how a mold will perform (or is performing) is to model the parts and feed systems.
While the customer or consumer may never see the feed system, it will influence factors such as the pressure to fill the mold, weld line location, part aesthetics and even dimensional stability.
Step 2: Define metrics
Often, team members who are designing and optimizing the manufacturing process do not use the same terminology. This disconnect in communication is a common problem with transferring simulation results to the process development team. Because of this, when determining the accuracy of a simulation, you must determine your measurement metrics first.
For example, “gate seal” refers to the time it takes for the gate to freeze off and prevent additional material from being injected into the mold cavity. During process development, a process engineer conducts a part weight versus hold-time study to determine when this occurs. Simulation analysts use the frozen layer fraction, for example, to help determine when the gate freezes off. When the frozen layer fraction reaches 100%, the entire cross-section of the gate is frozen, and no more material can be injected into the mold. However, currently, there is no commercial way for a process engineer to measure a mold’s frozen layer fraction, forcing people to use different systems to measure this point in the process, making it difficult to measure accuracy.
Figure 1 shows two different conclusions for gate seal time when these two systems are plotted against one another. This discrepancy does not indicate that one system is right; it demonstrates the variation in different measurement criteria. To determine which is correct, you need to close the loop, compare your simulation results to reality and adjust to physical molding limitations.
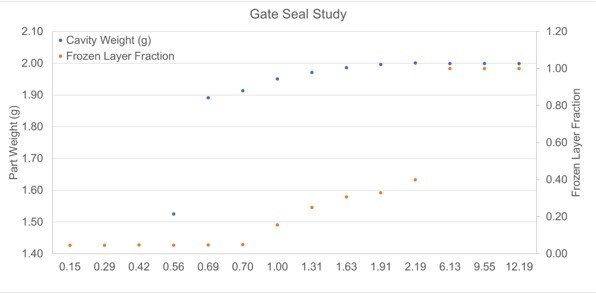
Figure 1. Using different systems to determine gate seal can lead to different conclusions. Photo Credit: The Madison Group
Fill time and transfer pressure are commonly used to help characterize a process, but different system metrics determine the proper fill time. For example, analysts will commonly use a combination of injection pressure to fill, melt temperature variation at the flow front, shear rates through the gate and frozen layer fraction to determine the desirable fill time. Yet, a process engineer will use a rheology curve, linearity study, part weight at transfer and part cosmetics to help determine the fill time.
Using different criteria makes it difficult to determine the correlation, but it is interesting to note that both can lead to very similar conclusions. Table 1 compares the fill time for a thin-walled polypropylene cap using a simulation and a scientific mold-filling study. The results are very comparable, so despite having different evaluation criteria, the two approaches yielded the “same” answer.

Table 1. A comparison of the fill and pack results between the simulation and actual measured, showing good correlation.
Step 3: Get the appropriate inputs
Once you establish the study’s objective and define the critical metrics, it is important to ensure the appropriate simulation inputs are available. If the objective is to create a digital twin of a physical mold and process, the digital mold must perform the same tasks as the real mold. You must make the simulation’s boundary conditions or inputs similar to those you are placing on the physical mold.
The most important input is characterizing the plastic molding resin for the mold-filling simulation, which requires measured data for the physical resin and appropriate flow models. Simply finding a similar melt flow rate material in the same family with similar fillers is not acceptable because the melt flow rate’s testing conditions do not represent those conditions experienced during injection molding.
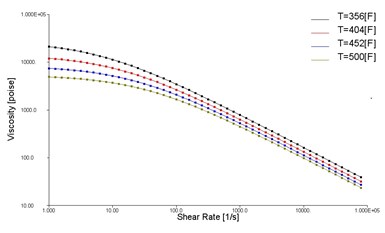
Figure 2. Plot showing how viscosity changes with increasing shear rates.
Additionally, injection molding commonly focuses on thermoplastic materials’ shear behavior due to its shear thinning behavior. This is one reason injection molding uses faster fill speeds during injection. As the material experiences more shear, the viscosity of the resin decreases (see Figure 2). However, shear deformation is only one of the deformation modes experienced in injection molding. There are also extensional deformation forces, where the material is stretched as it flows through the mold’s cross sections. These flow restrictions often occur in the mold’s feed system, especially at the gate. When you use a hot manifold system, tunnel gate or pin gate to fill the cavity, you must characterize the material’s extensional viscosity.
Figure 3 compares an injection pressure curve during the initial mold-filling stages when the resin is characterized for shear and extensional viscosity and when it is only characterized for shear viscosity. The clear difference is that there is an under-prediction of pressure to fill the mold when you ignore the extensional viscosity. The cost and time investment in characterizing the extensional viscosity is minimal and can substantially influence early design decisions. You can make decisions such as minimum part wall thickness, gate and runner sizing and process feasibility before any chips are cut, saving time and money.
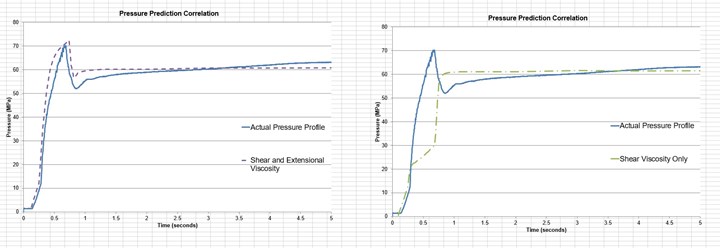
Figure 3. Accounting for shear and extensional viscosity helps to accurately predict pressure to fill the mold.
From a mold design perspective, to properly predict injection pressures during initial mold filling, you must include the feed system and mold cavities in the model. Including the runner and gates into the model helps improve the pressure prediction accuracy and helps design the feed system to impart shear on the molten plastic, heat the material and permit a lower viscosity in the mold cavity.
However, this additional flow length and the feed system’s characteristic cross section will yield more pressure loss during the mold filling process. If you ignore these mold design aspects, you will under-predict the requirements to manufacture a part and have little chance of convincing your co-workers of the value of upfront simulation.
If you do not include the feed system (runner and gates), any pressure comparisons at the press with a simulation will waste time since you do not measure the pressure at the same locations. While this seems like an obvious statement, such a detail is often lost when comparing simulation to real life and can raise concerns about the simulation results’ fidelity.
The last critical simulation inputs for properly capturing the resin’s shear and thermal conditions during mold filling include a representative melt temperature, the mold temperature and the proper polymer flow rate into the mold. Figure 4 shows that when those conditions are properly modeled, you can capture the maximum pressure to fill the mold and the entire injection pressure profile with good correlation during the entire mold filling stage.
Step 4: Close the loop and correlate
Simulation is often viewed as an early development process step where the report is filed away without being shared with the process engineer. This is a great disservice to any simulation investment because the process engineer will end up taking extra steps and time at the press to reestablish parameters that the simulation determined to be successful.
This does not mean that the process must be set up to match the simulation, only that the simulated results can help a process engineer narrow the initial scope and find solutions to issues not initially defined in the simulation scope.
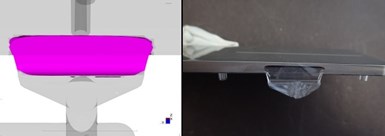
Figure 4. By closing the loop and providing process engineers with simulation results even cosmetic defects can be predicted with simulation.
Despite all the advances with in-mold sensors for injection molding, the information that a process engineer can gather for process troubleshooting is still limited. Simulation results can empower a process engineer to troubleshoot issues more quickly and provide feedback on the issues to develop a more robust process window for the part (see Figure 4).
Now that the stage is set for success, the next article will discuss how simulation can help you size your feed systems for optimal filling and part aesthetics.
Related Content
How a Small Programming Change Cuts Cycle Time in Half
Overriding the CAM system when milling a series of lifter pockets helps to improve metal removal rate and increase feed rates.
Read MoreTolerancing in Mold Design, Part 2: Using GD&T to Address Conventional Tolerancing Issues
Mold designers can achieve a single interpretation of workpiece functionality when following the American Society of Mechanical Engineers Geometric Dimensioning and Tolerancing standard.
Read MoreHow to Fix Predicted Warpage Before It Happens with Windage and CAD Model Morphing
Applying windage and model-morphing techniques saved toolmaker/molder Sturgis Molded Products the time, cost, headaches of multiple part/mold design iteration loops, cumbersome cooling fixtures, and long molding cycles.
Read MoreMold Design Review: The Complete Checklist
Gerardo (Jerry) Miranda III, former global tooling manager for Oakley sunglasses, reshares his complete mold design checklist, an essential part of the product time and cost-to-market process.
Read MoreRead Next
How to Use Strategic Planning Tools, Data to Manage the Human Side of Business
Q&A with Marion Wells, MMT EAB member and founder of Human Asset Management.
Read MoreHow to Use Continuing Education to Remain Competitive in Moldmaking
Continued training helps moldmakers make tooling decisions and properly use the latest cutting tool to efficiently machine high-quality molds.
Read MoreReasons to Use Fiber Lasers for Mold Cleaning
Fiber lasers offer a simplicity, speed, control and portability, minimizing mold cleaning risks.
Read More


