Setting Up a Robust Process Forever
Deciding how to process a product with the least amount of part variation over the long term.
In previous articles we have discussed part design basics, mold design considerations, getting the right mold in the right molding machine, machine performance evaluations, mold tryout evaluations and when to adjust the tool steel.
In this article we need to decide how to process a product with the least amount of part variation over the long term. Processes that require constant maintenance or adjustments do not provide the most profitable condition.
If you have been following the recommendations in the previous articles, much of your process testing has been completed through the use of a rigorous mold tryout (viscosity curve, cavity balance, temperature maps of mold and part, gate seal, etc.) and all of the machine testing has been completed as well (injection speed linearity, check ring study, injection response and load sensitivity). Many of these tests are completed by building a very simple decoupled II process, where you separate fill from pack and hold by transferring when the cavity is 95 percent full.
Forced Vicosity Change
We now need to run this process to see how stable it will be over time. However, it is not sufficient to run several hundred shots during a single setup with the same batch of material. Instead, it is important to challenge the process by introducing the type of variation that will inevitably be seen in production. One of the most effective ways to do this is through the use of a forced viscosity change. Usually it is best to introduce at least a 10-percent viscosity change to see how well the process will absorb the variation.
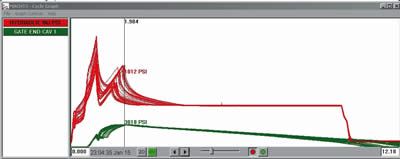
Through the use of sensors and data acquisition we can see a graphical representation of a hydraulic and post gate curve, and how well cavity conditions are repeated in the face of a viscosity change. In Figure 1 we can see that the machine is repeating very well, (the red hydraulic curves overlay one another), although the post gate curve (green) has a large band width, indicating a large cavity pressure variation does exist. As the cavity pressure changes it affects part dimensions. The goal is to reduce the variation in the cavity as much as possible.
Decoupled II processes, like the one shown in Figure 1, do not require the use of data acquisition equipment or cavity pressure sensors, making it less expensive to implement. If the product being molded has less stringent quality requirements, a decoupled II process may be all you need to achieve your quality target.
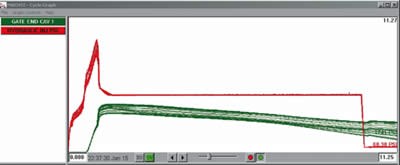
If you still see an unacceptable amount of variation with a decoupled II process, then advancing to a decoupled III (cavity pressure control) process can help to achieve greater process capability. This processing technique provides the separation of fill, pack and hold as separate functions. Figure 2 shows a decoupled III process using the same mold as Figure 1.
Here we can see that the machine is adjusting to compensate for the change in viscosity. Although this makes the press appear inconsistent, in fact this compensation is exactly what is required to repeat in-cavity conditions when process variations occur. This in turn will provide more consistent parts.
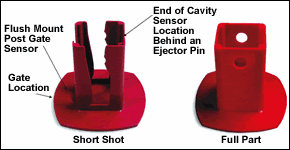
In most cases, decoupled III molding requires a post gate sensor for control (located in the cavity just past the gate). Another option to be considered is a mid-stream cavity pressure sensor or an end-of-cavity sensor. Many years ago cavity pressure control from these locations was not an option, due to the older molding machines’ inability to transfer rapidly. However, with today’s presses, we tend to see significant benefits when controlling from these locations.
Application
The following is an example. A shop trying to find the best possible process for a product (the hitch cover seen in Figure 3) that had very little profit margin. The molding machine was relatively new and a powerful production and process control system was connected to the machine, which allowed the potential for cavity pressure control.
| Decoupled III Process with Cavity Pressure Transfer | ||
| Post Gate Pressure Peak |
Post Gate Transfer | End of Fill Transfer |
| High |
8022 | 7747 |
| Average |
8009 | 7531 |
| Low | 7998 | 7436 |
| Standard Deviation | 7.991 | 80.22 |
| Expected Variation % | 0.5986 | 6.387 |
| End of Cavity Pressure Peak | ||
| High | 8723 | 8057 |
| Average | 8527 | 8042 |
| Low | 8122 | 8008 |
| Standard Deviation | 158.7 | 12.33 |
| Expected Variation % | 11.17 | 0.9201 |
| Figure 4: Decoupled III process statistics. | ||
As a decoupled III process was completed, a series of shots was run and the pressure at both ends of the cavity (post gate and end of cavity) during a viscosity change was recorded, as noted in Figure 4. In the first column the cavity pressure changes were noted, as well as standard deviation and expected variation from the decoupled III process with post gate control. To evaluate the percentage of change in cavity pressure at that location, they took post gate high (8022ppsi) minus post gate low (7998ppsi) divided by post gate high (8022ppsi) times 100, which indicates a change of .299%. Using the same formula to calculate the pressure variation at end of cavity indicates a 6.98% variation.
Without introducing any additional variables, the post gate transfer was changed to the end of cavity and all other settings were left the same. End of cavity pressure variation is now much less (0.61% as compared to 6.89% with post gate transfer) and if the critical dimensions part, this is fantastic as it eliminates more variation in this area of the cavity. The post gate pressure variation went to 4 percent compared to 3 percent with post gate transfer. Overall the cavity conditions in this case were better with less cavity pressure variation making this strategy a wise choice.
Summary
In summary of this series of articles, we now know we need to do our homework up front during the quoting stages, get the right tool in the right molding machine, complete a rigorous mold tryout, then adjust the steel, and last and most important, build the best process that will require the least amount of maintenance. You must exhaust all process capabilities (leaving no stone unturned). Don’t allow your processes to be constantly tweaked in order to make good parts. It simply isn’t affordable to produce parts like that anymore.
![]()
Related Content
Tackling a Mold Designer Shortage
Survey findings reveal a shortage of skilled mold designers and engineers in the moldmaking community, calling for intervention through educational programs and exploration of training alternatives while seeking input from those who have addressed the issue successfully.
Read MoreThe Role of Social Media in Manufacturing
Charles Daniels CFO of Wepco Plastics shares insights on the role of social media in manufacturing, how to improve the “business” side of a small mold shop and continually developing culture.
Read MoreMaking Quick and Easy Kaizen Work for Your Shop
Within each person is unlimited creative potential to improve shop operations.
Read MoreMMT Chats: Solving Schedule and Capacity Challenges With ERP
For this MMT Chat, my guests hail from Omega Tool of Menomonee Falls, Wisconsin, who share their journey with using enterprise resource planning (ERP)—and their people—to solve their schedule and capacity load monitoring challenges.
Read MoreRead Next
Has the Molding Machine Been Tested?
Knowing how a machine is tuned will improve your decision making for mold construction and adjustments.
Read MoreReasons to Use Fiber Lasers for Mold Cleaning
Fiber lasers offer a simplicity, speed, control and portability, minimizing mold cleaning risks.
Read MoreHow to Use Continuing Education to Remain Competitive in Moldmaking
Continued training helps moldmakers make tooling decisions and properly use the latest cutting tool to efficiently machine high-quality molds.
Read More




.jpg;maxWidth=300;quality=90)



.jpg;maxWidth=970;quality=90)