


In the U.S., we are accustomed to the standard of measurement for defining mold surfaces set forth by the Society of the Plastics Industry (SPI), but elsewhere in the world, they use measurements as roughness average (RA), root mean square (RMS) and micro inch finish.
How do they relate? What do they mean? To our knowledge, no charts exist that lay these units of measure side by side in a conversion format so that companies can confidently understand what they are dealing with. That’s what we’ll attempt to produce with this discussion.


A Gray Area
In most minds, determining surface profile or roughness is a gray area. So, it would probably make sense to build some frame of reference by understanding how the RA and RMS are defined and measured.
RA is defined as the arithmetic average deviation of the surface valleys and peaks and is usually used to describe the roughness of a machined surface. It is identical to the I.S.O. measurement known as center line average, or CLA, and is also equal to the arithmetic average mentioned a moment ago. The term “RA” has simply taken over as the term of preference over the others, even though they have been around for some time.
RMS is defined as the root mean square average of the profile height deviations from the mean line of the surface. It is mostly used to describe the finish of an optical surface.
Both of these measurements are expressed in micro inches, the symbol of which is this: µ”.
Commonly Used Surface Measurement Symbols
Micron = µ
Micro Inch = µ"
Micrometer = µm
Millimeter = mm
To give some perspective as to the size of each of these units of measure, take a look at the following:
Basic Measurement Equivalents
1 micro inch (µ") = 0.000001 of a standard U.S. inch.
1 micro inch (µ") = 0.0254 microns (µ)
1 micro inch (µ") = 0.0254 micrometers (µm)
0.001" = 0.0254mm
If this isn’t very clear, we’re about to muck up the waters a little further by saying that all measurements are approximate. There is no direct correlation or conversion between RA and RMS, as there can be as much as a 25% margin of error. But in the mold industry, we ultimately regard both equally because of the scales we work within.
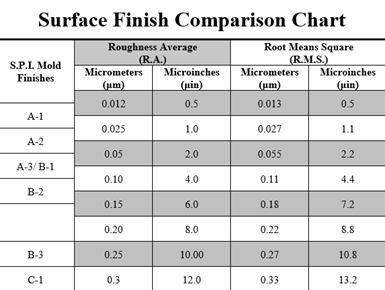
Surface finish comparison. Note that comparison values can vary by up to 25%. Photo Credit, all: Bales Mold Service
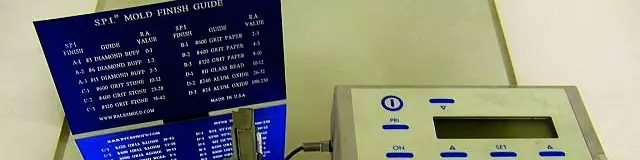
How do these relate to SPI? Take a look at the chart we assembled. In the U.S., most of us are very familiar with the SPI’s standard surface finish definitions, such as an A-1 diamond buff, C-1 Grit Stone or a B-2 Grit Paper finish. As you can see, the RA equivalent value of that A-1 diamond buff is a 0 – 1µ, while the C-1 Stone finish has a 10 – 12µ RA value and the B-2 Paper finish has a 4 – 5µ RA value.
The RMS values are very similar, and the difference between them is a division of millionths. Is it necessary to be that exact? Probably not. Even when a surface is measured at 10 microns RA, the difference between that and its RMS counterpart is 0.8 of a millionth. However, once you start dealing with values over 10 microns, the differences between RA and RMS begin to
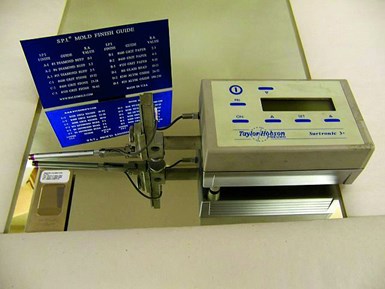
A profilometer — one device used to measure surface texture alongside the SPI Mold Finish Conversion Guide.
jump. Now, many variables begin to come into play as waviness spikes in the profile of the mold surface and the length of the sample area being tested become a factor. A typical instrument used to measure these factors is called a profilometer. This exacting tool is so accurate it can be calibrated and traced to NIST standards.
Now that we’ve determined what RA and RMS are and how they are measured and correlate to the more familiar SPI standards, we can begin to understand how they relate to the molds we manufacture. Fortunately, the science behind them can be left to a qualified vendor who can help you achieve the surface finish your customer requires.


Related Content

What You Need to Know About Hot Runner Systems and How to Optimize Their Performance
How to make the most out of the hot runner design, function and performance.
Read More
Machine Hammer Peening Automates Mold Polishing
A polishing automation solution eliminates hand work, accelerates milling operations and controls surface geometries.
Read More
Hands-on Workshop Teaches Mold Maintenance Process
Intensive workshop teaches the process of mold maintenance to help put an end to the firefighting culture of many toolrooms.
Read More
What is Scientific Maintenance? Part 2
Part two of this three-part series explains specific data that toolrooms must collect, analyze and use to truly advance to a scientific maintenance culture where you can measure real data and drive decisions.
Read MoreRead Next

Build-Ups for Maintenance: Benefit or Band-Aid?
When is providing build-ups on tooling appropriate and when is it just a band-aid on a problem that could lead to more extensive repairs later?
Read More
Are You a Moldmaker Considering 3D Printing? Consider the 3D Printing Workshop at NPE2024
Presentations will cover 3D printing for mold tooling, material innovation, product development, bridge production and full-scale, high-volume additive manufacturing.
Read More
How to Use Strategic Planning Tools, Data to Manage the Human Side of Business
Q&A with Marion Wells, MMT EAB member and founder of Human Asset Management.
Read More